Physics II Day 8: Introduction to Graphs of Motion |
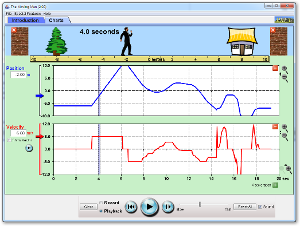
| The Moving Man PhET Simulation |
BIG Idea – Quick Read
Background
All motion can be represented using graphs. There are three types of
graphs used to describe how an object moves over time: Position v. Time graphs,
Distance v. Time graphs or Speed v. Time graphs. What you are trying to
demonstrate or measure will determine which graph is best to use.
Position v. Time Graphs
Position graphs show an object’s location compared to a reference point.
Imagine you are in a car with your mom, driving 30 mph (miles per hour) to your
house. If you compare your body’s motion to your mom’s, you are not in motion.
If you compare your body to a green light you drive through, you are moving at
30 mph. If you compare your motion to a jogger that is running on the street in
the same direction you are, you are moving around 25 mph. These are all reference
points, or objects or locations that you compare an object’s motion to. Position
graphs show motion relative to a specific location.
Distance v. Time Graphs
Distance graphs do not compare motion to a reference point. Instead,
they show the total distance covered over time. For example, if you walk 30
meters to the water fountain, and back to your classroom another 30 meters,
your total distance would be 60 meters on a Distance v. Time graph.
Speed v. Time Graphs
Speed graphs show how fast an object moves over time. For example, if
you are riding your bike at
10 mph, and stop to talk to a friend, then ride off at 15 mph, a speed graph
will show this motion. It will not show your total distance or compare your
motion to a reference point.
Let’s
Try as a Class - Different
Graphs, Different Stories
Directions: In this
activity, you will create the three types of graphs using the same story.
The Story:
1.
You leave your math classroom to go to the restroom. Your teacher gave you
a 3 minute pass. It is 100 meters to the restroom from your math class.
2.
The restroom is at the end of the hall. It takes you 30 seconds to get the
restroom. You are in the restroom for 90 seconds.
3.
You walk 50 meters in 15 seconds back towards math, and then stop to talk
to a friend for 30 seconds. You finally hurry the remaining 50 meters back to
math class in 10 seconds.
What?
BIG Ideas:
- Remember that speed is a measure of distance traveled in a certain time. Speed can be visualized in a line graph.
- Why? Good scientists can communicate their findings!
How?
- Time will be plotted on the x-axis and distance on the y-axis.
- If you are given time and asked to find distance, find the given time and move up to find the distance.
- If you are given distance and asked to find time, find the distance and move right to find the time.
- To find the average speed, just remember total distance divided by total time.
- Notice how the slope and velocity are related!
Let’s Try As
a Class:
1) How far had Monica run after 4 seconds?
2)
About how long did it take Monica to run 80 meters?
3) How far did she run between 5 and 8
seconds?
4) What was her average speed?
Speed Graphs With Your Shoulder Buddy (at a “one” voice level)
1. Mr. V took a drive yesterday. He then graphed out his average
speed. The following graph shows the amount of miles he traveled in 5 hours.
a) About how far had he traveled after 1 hour?
b) How long did it take him to travel 240
miles?
c) What was Mr. V’s average speed, in miles
per hour?
2. Henry and Angel raced their
cars down a street late at night. The following graph shows how far they
traveled after 10 seconds. (PS: Street racing is dangerous and usually
illegal!)
a) After how many seconds were Henry and
Angel completely even in their race?
b) After 4 seconds, about how many more
meters had Henry traveled than Angel?
c) Who won the race? How do you know?
Speed Graphs On Your Own
3. Eduardo rode his bike across the city. The following graph shows his average speed in kilometers per hour.
a) How far had he traveled after 2 hours?
b) How long did it take him to travel 6 kilometers?
c) What was Eduardo's average speed, in kilometers
per hour?
4. The following graph shows Odalys’s 1000 meter dash time
a) How far had Odalys run after 40 seconds?
b) About how long did it take for her to run
900 meters?
b)
About how long did it take Odalys to run 80 meters?
5. The line graphs shows Edgar’s test of a rocket-powered car.
a) The car did not move from seconds:
a) 0-2 b)
4-6
c) 2-4 d) 8-10
c) 2-4 d) 8-10
b) After 2 seconds, the car travelled about:
a) 45 m b)
50 m c)60m d) 100 m
c) The car traveled about ____________ meters of total distance.
-->
Analyzing Graphs of Motion Lifework
The graph above shows a race between a chicken and a hamster.
1) How far had the chicken travelled after 10
seconds? _____________________________________
2) After 25 seconds, how much further ahead
was the chicken? _________________________________
3) To find
the chicken’s speed, you would divide _______________ meters by ______________
seconds.
Graph this runner’s movement. Label the units that should go on
each axis.
Seconds
|
Meters
|
0
|
0
|
1
|
5
|
2
|
10
|
3
|
15
|
4
|
25
|
5
|
33
|
6
|
40
|


No comments:
Post a Comment