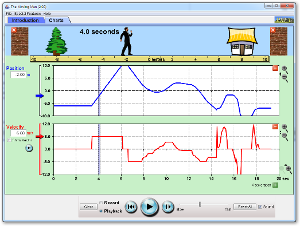
The following graph shows some of Mr. Miller’s drive or commute home from KIPP.

What’s different about this
graph?
Between what hours was Mr. Miller not moving? What do you think was happening?
At what hour did Mr. Miller
begin going home?
Between what hours was Mr. Miller’s
speed the greatest?
a)
0-1
b)
1-2
c)
3-4
d)
4-5


- Play the Graph of Motion game here. Afterwards, answer the questions on your classwork.
No comments:
Post a Comment